
[K6] 부하 테스트 도구 스터디
오픈소스 부하테스트 도구 K6 탐험기
공식문서 : https://grafana.com/docs/k6/latest/
서비스의 부하를 테스트하는 방법에 대해 알아보다 Grafana 진영에서 개발한 오픈소스로 서비스의 부하를 테스트하고 결과를 볼 수 있다.
잠시 찍먹해 본 결과 아주 쉽게 부하 테스트를 할 수 있어 보인다.
방식은 사전에 정의된 테스트 케이스, 방법이 적힌 스크립트를 만든 다음에 명령어를 통해서 부하를 테스트 해볼 수 있다.
아래와 같은 결과를 볼 수 있다.
// script.js
import http from 'k6/http';
import { check, sleep } from 'k6';
import { Rate } from 'k6/metrics';

// 실패율 추적용 사용자 정의 메트릭
export let failureRate = new Rate('http_req_failed');

export let options = {
  stages: [
    { duration: '10s', target: 5000 },   // 0초~10초: 5,000명까지 증가
    { duration: '10s', target: 10000 },  // 10초~20초: 10,000명까지 증가
    { duration: '10s', target: 15000 },  // 20초~30초: 15,000명까지 증가
    { duration: '10s', target: 10000 },  // 30초~40초: 10,000명으로 감소
    { duration: '10s', target: 0 },      // 40초~50초: 0명으로 감소 (종료)
  ],
  thresholds: {
    'http_req_duration': ['p(95)<500'],     // 95% 요청이 500ms 이내
    'http_req_failed': ['rate<0.01'],       // 실패율 1% 미만
  },
};

export default function () {
  let res = http.get('http://192.168.0.6:32290/');  // 테스트 대상 주소

  // 응답 코드가 200인지 확인
  const success = check(res, {
    'status is 200': (r) => r.status === 200,
  });

  // 실패율 메트릭 기록
  failureRate.add(!success);

  sleep(1.5);  // 사용자별 대기 시간
}
위와 같은 스크립트를 만들고 나서 명령어를 실행하면 아래와 같은 결과가 나오는 것을 볼 수 있다.
# k6 run script.js

         /\      Grafana   /‾‾/
    /\  /  \     |\  __   /  /
   /  \/    \    | |/ /  /   ‾‾\
  /          \   |   (  |  (‾)  |
 / __________ \  |_|\_\  \_____/

     execution: local
        script: test.js
        output: -

     scenarios: (100.00%) 1 scenario, 15000 max VUs, 1m20s max duration (incl. graceful stop):
              * default: Up to 15000 looping VUs for 50s over 5 stages (gracefulRampDown: 30s, gracefulStop: 30s)


  █ THRESHOLDS

    http_req_duration
    ✓ 'p(95)<500' p(95)=52.68ms

    http_req_failed
    ✓ 'rate<0.01' rate=0.00%


  █ TOTAL RESULTS

    checks_total.......................: 271150  5262.815577/s
    checks_succeeded...................: 100.00% 271150 out of 271150
    checks_failed......................: 0.00%   0 out of 271150

    ✓ status is 200

    HTTP
    http_req_duration.......................................................: avg=16.26ms min=1.95ms med=8.53ms max=1.02s p(90)=38.42ms p(95)=52.68ms
      { expected_response:true }............................................: avg=16.26ms min=1.95ms med=8.53ms max=1.02s p(90)=38.42ms p(95)=52.68ms
    http_req_failed.........................................................: 0.00%  0 out of 542300
    http_reqs...............................................................: 271150 5262.815577/s

    EXECUTION
    iteration_duration......................................................: avg=1.51s   min=1.5s   med=1.5s   max=3.51s p(90)=1.53s   p(95)=1.55s
    iterations..............................................................: 271150 5262.815577/s
    vus.....................................................................: 220    min=220         max=15000
    vus_max.................................................................: 15000  min=15000       max=15000

    NETWORK
    data_received...........................................................: 234 MB 4.5 MB/s
    data_sent...............................................................: 20 MB  384 kB/s


running (0m51.5s), 00000/15000 VUs, 271150 complete and 0 interrupted iterations
default ✓ [======================================] 00000/15000 VUs  50s
이를 잘 활용하면 서비스 개발 단계에서 테스트가 잘 되게 할 수 있을것 같아 보인다.
이를 잘 테스트 하는 방법이 뭘까?
k6-operator
쿠버네티스에서 효과적으로 k6를 운영하기 위한 오퍼레이터가 존재한다.
아직 0.X 버전에 머물러 있는데 충분히 사용할 만해 보여 연구를 진행해 본다.
이를 이용해서 서비스를 테스트하고 결과를 확인해 보자.
설치 : https://grafana.com/docs/k6/latest/testing-guides/running-distributed-tests/
make를 이용해서 설치함에 유의한다.
git clone https://github.com/grafana/k6-operator && cd k6-operator
make deploy

kubectl get pod -n k6-operator-system
NAME                                              READY   STATUS    RESTARTS   AGE
k6-operator-controller-manager-54f445c478-c8sb2   2/2     Running   0          20s
이렇게 하면 CRD와 오퍼레이터는 설치가 완료 되었다.
이제 이를 이용해서 테스트를 할 수 있도록 해보자.
k6-operator을 이용한 테스트 진행
이제 테스트 스크립트를 PV나 configmap으로 만들면 테스트를 날릴 수 있다. 다만 configmap을 이용한 테스트를 할 때는 크기가 1MB로 제한됨에 유의해야 한다.
대부분 테스트 스크립트는 1MB 안쪽이기 때문에 큰 문제는 없어 보인다.
이전에 만든 스크립트를 configmap 으로 만들어 본다.
kubectl create configmap test-script --from-file test.js
configmap/test-script created
이제 CRD를 만들어 테스트를 해보도록 하자.
apiVersion: k6.io/v1alpha1
kind: TestRun
metadata:
  name: run-k6-from-configmap
spec:
  parallelism: 4
  script:
    configMap:
      name: test-script
      file: test.js
동시에 여러개의 pod를 만들어서 테스트 할 수도 있다.
다만 생각보다 k6가 메모리를 많이 사용하는 것 같아 이 부분에 대해 유의가 필요해 보인다.
프로메테우스로 결과를 출력하자
테스트 결과를 프로메테우스로 출력하고 이를 모니터링하여 볼 수 있다.
프로메테우스에서 최근에 stable가 된 web.enable-remote-write-receiver 기능을 활성화 해주어야 한다.
helm upgrade monitoring prometheus-community/kube-prometheus-stack \
  --namespace monitoring \
  --reuse-values \
  --set "prometheus.prometheusSpec.additionalArgs[0].name=web.enable-remote-write-receiver" \
  --set "prometheus.prometheusSpec.additionalArgs[0].value=\"true\""
그후 설정을 아래와 같이 업데이트 해준다.
(역시 메모리를 많이 사용함에 유의)
apiVersion: k6.io/v1alpha1
kind: TestRun
metadata:
  name: run-k6-from-configmap-20250607-0138
  namespace: k6
spec:
  parallelism: 1
  script:
    configMap:
      name: test-script
      file: test.js
  arguments: --tag testid=run-k6-edward-20250607-0138 --log-format json -o experimental-prometheus-rw
  runner:
    image: grafana/k6:0.44.0
    env:
      - name: K6_PROMETHEUS_RW_SERVER_URL
        value: http://192.168.0.6:32525/api/v1/write
    resources:
      limits:
        memory: "15Gi"
    livenessProbe:
      httpGet:
        path: /v1/status
        port: 5665
      initialDelaySeconds: 50
      periodSeconds: 50
      failureThreshold: 3
해당 결과를 출력하면 Grafana 와 연동하여 기본적으로 제공해주는 대시보드에 연동해서 결과를 볼 수 있다.
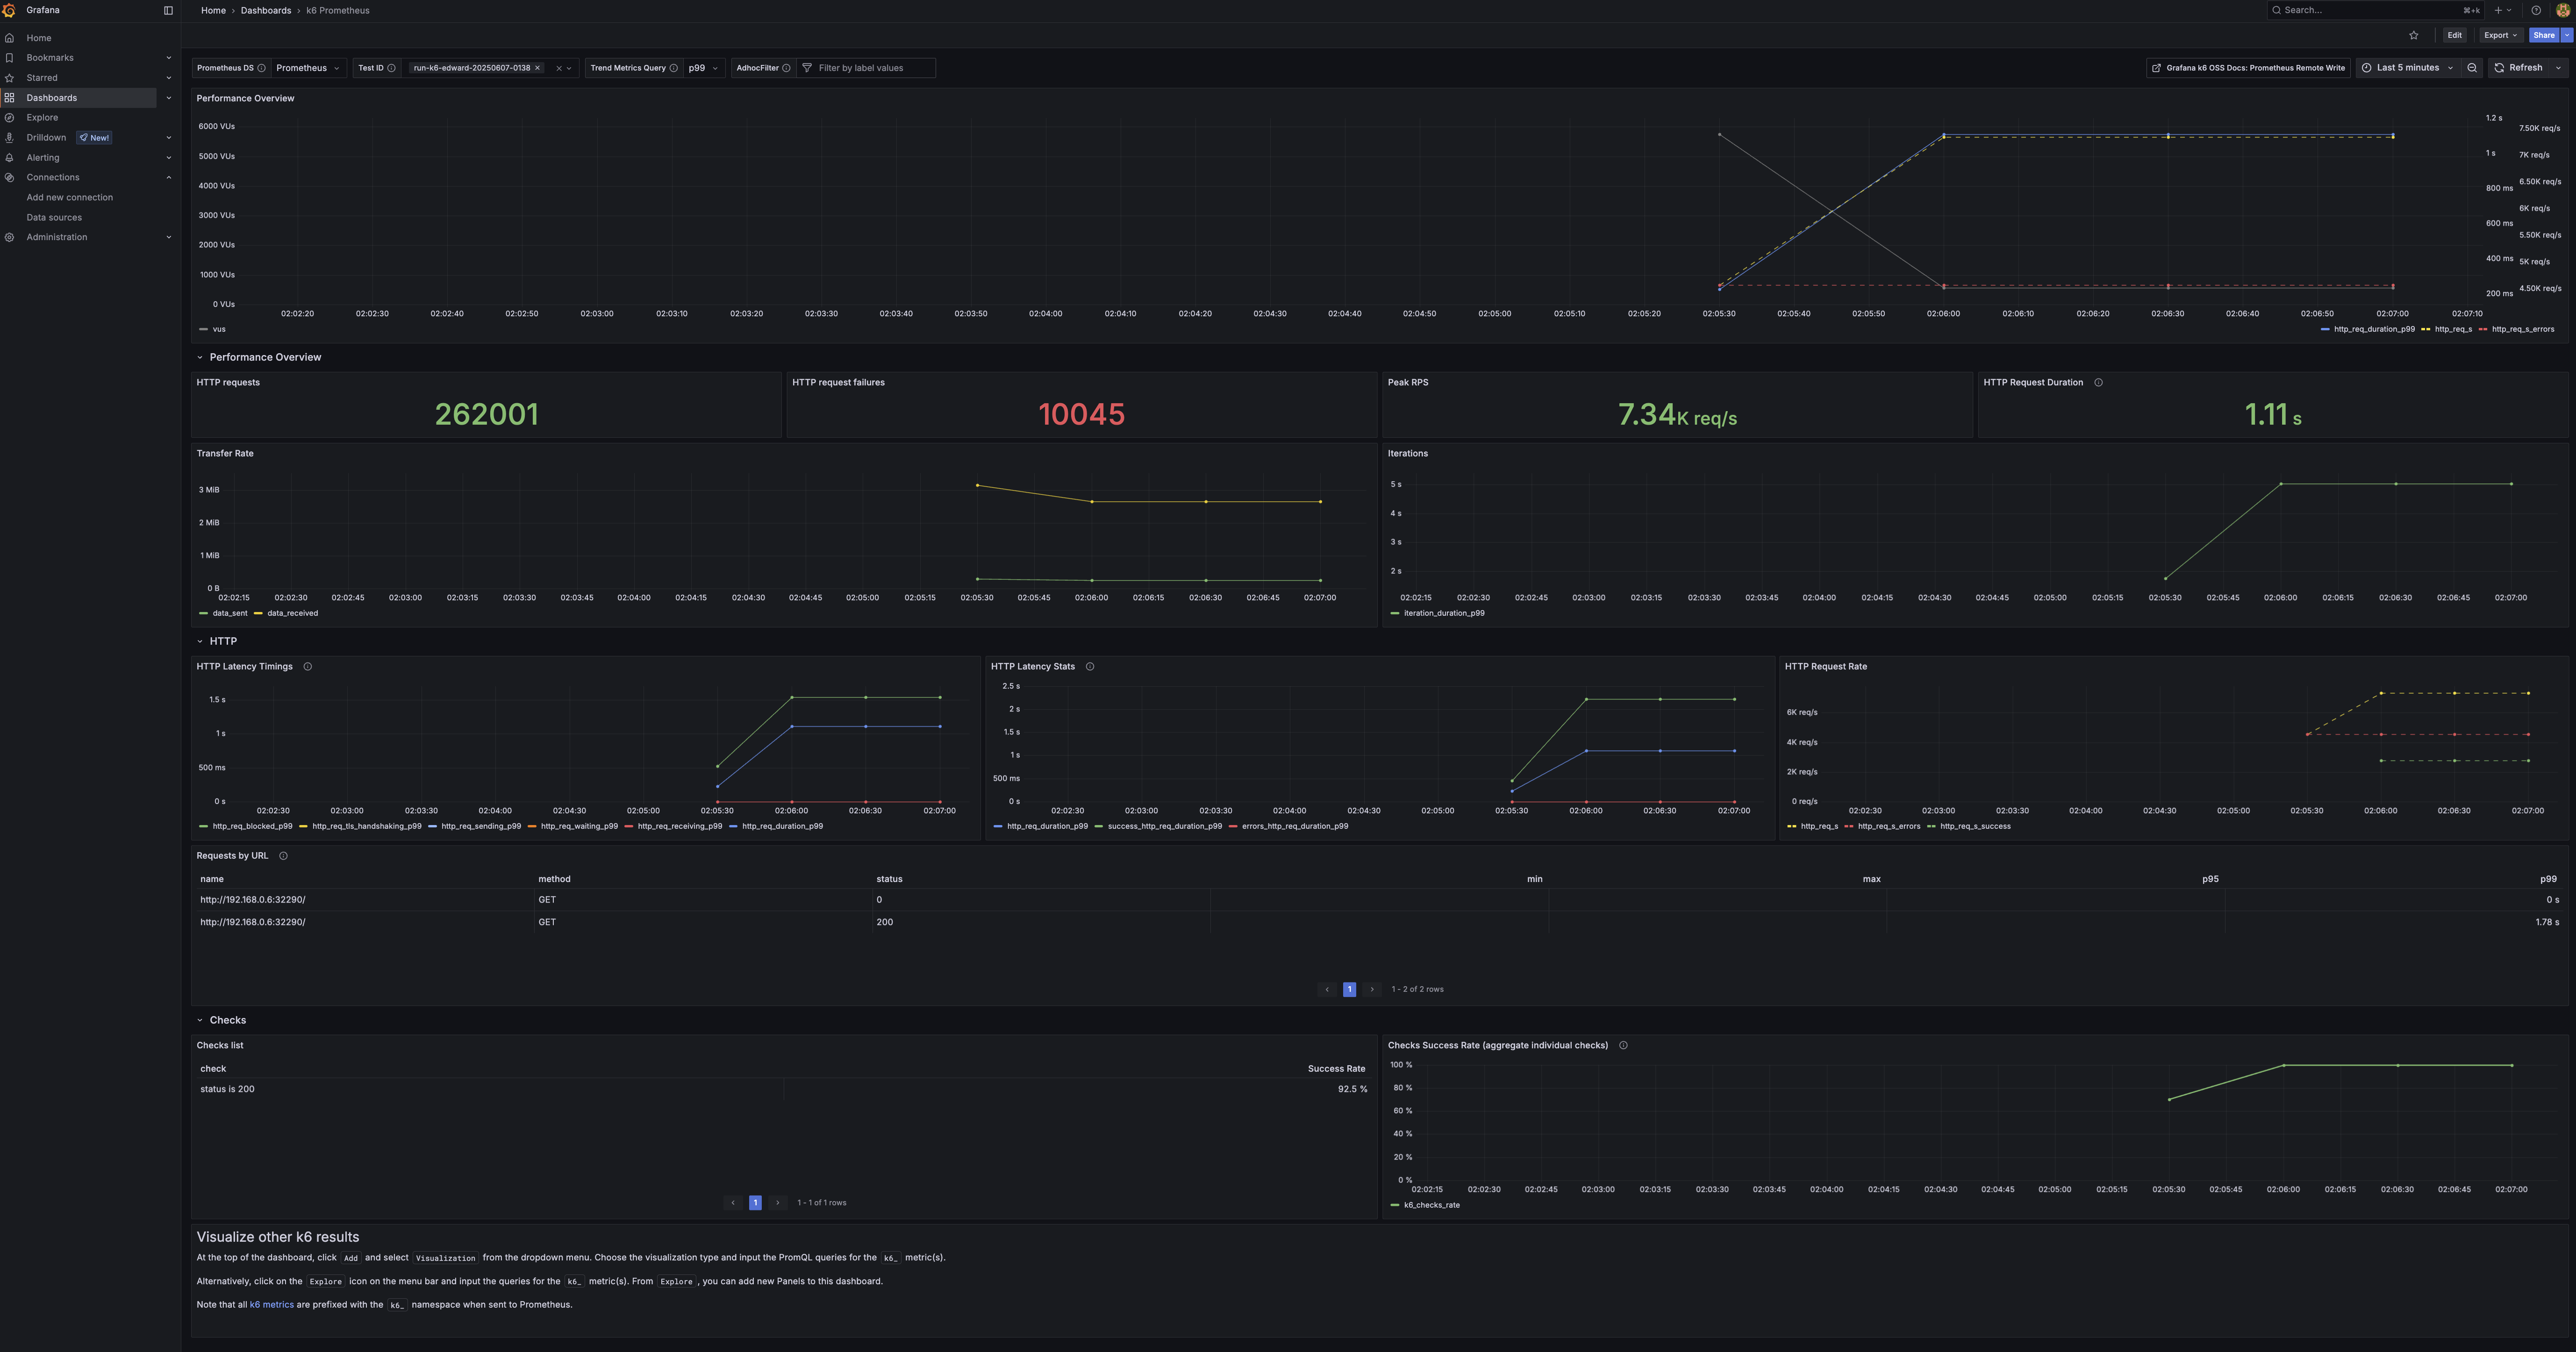
대시보드를 잘 구성하면 test한 pod의 자원 사용량과 함께 테스트 결과를 같이 보여줄 수 있을 것 같다.
Comments